• About
  • Advertise
  • Privacy Policy
  • Contact
Over View - Your Daily News Source
  • Home
  • News
    • Business
    • Politics
    • Science
  • Lifestyle
    • Food
    • Travel
    • Health
    • Fashion
  • Entertainment
    • Entertainment
    • Sports
  • Tech
No Result
View All Result
  • Home
  • News
    • Business
    • Politics
    • Science
  • Lifestyle
    • Food
    • Travel
    • Health
    • Fashion
  • Entertainment
    • Entertainment
    • Sports
  • Tech
No Result
View All Result
Over View - Your Daily News Source
No Result
View All Result
Home News Science

This X-ray image shows our solar system ‘breathing’

admin by admin
April 24, 2026
in Science
0
This X-ray image shows our solar system ‘breathing’
0
SHARES
0
VIEWS
On the left, a circle shows colorful blobs that make sort of a line pattern in the center. On the right, streaks move outward from a central point.
Illustration of the separation of the SWCX foreground emission from the cosmic X-ray sky, for the Western Galactic hemisphere. The stripe patterns visible in the SWCX image result from temporal variations in foreground emission combined with eROSITA’s scanning geometry.
(Image credit: MPE)

Astronomers have, for the first time, spotted the “breath of the solar system.” The finding comes in the form of X-ray emissions generated when the electrically charged solar wind slams into both Earth’s atmosphere and the bubble that surrounds our solar system, the heliosphere.

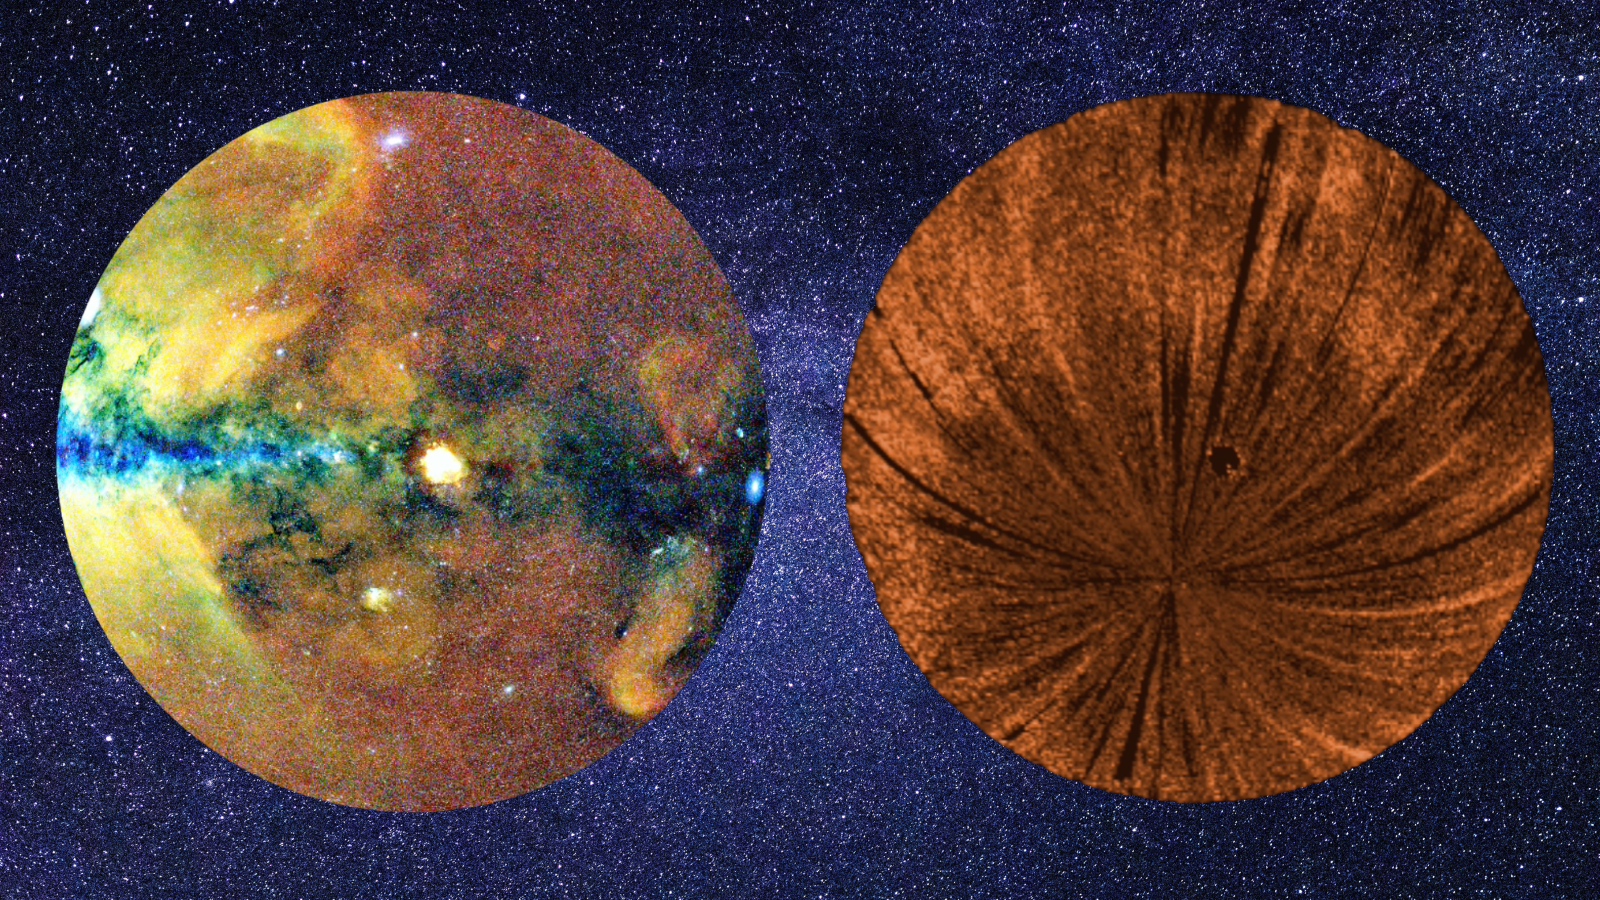
This phenomenon, known as “solar wind charge exchange,” was observed by the eROSITA space telescope, allowing a team of scientists to create a map of the sky in so-called “soft X-rays.” This X-ray glow is radiated when the heavy ions of the solar wind, like carbon and oxygen, grab an electron from neutral atoms in either our outer atmosphere or the heliosphere.

A wide map with a bluish pattern in a line going horizontally through the center. There are red, yellow, orange and green splotches throughout.

Reconstruction of how the diffuse X-ray sky should have appeared to eROSITA from May to October 2021. At any given moment, eROSITA has observed only a 1° wide field along its scanning direction, which is indicated by a cyan curve. Each 360° scan took 4 hours and was done approximately perpendicularly to the direction of the Sun, which is located in the overexposed moving region. (Image credit: K. Dennerl, J. Sanders, H. Brunner & the eSASS team (MPE); E. Churazov, M. Gilfanov (IKI))

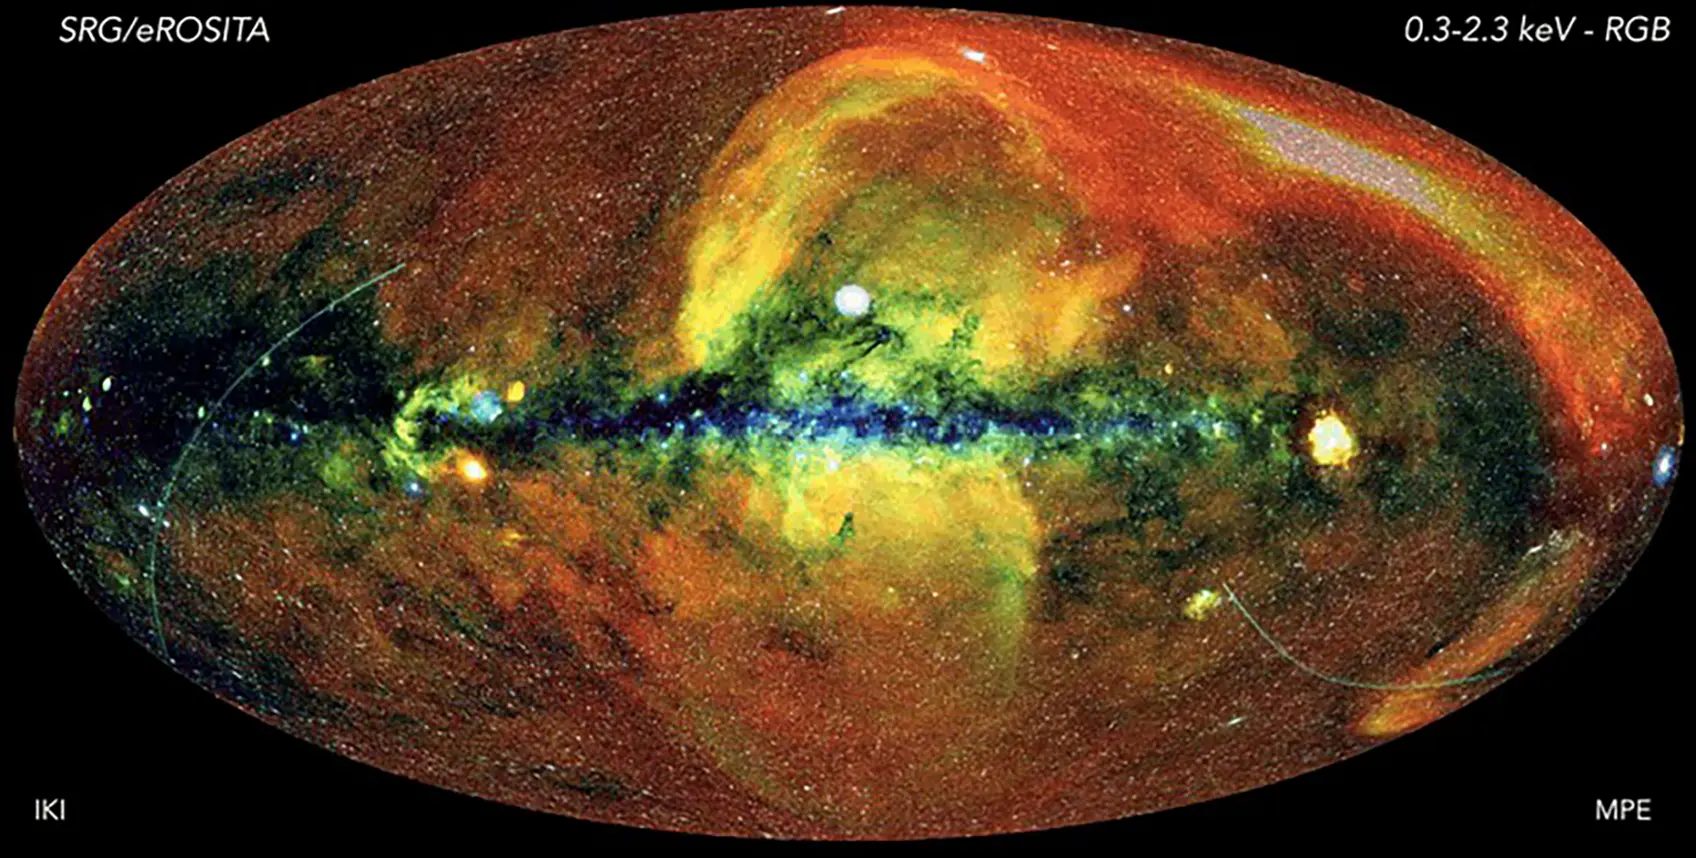
Launched by Russia’s space agency Roscosmos on July 13, 2019, eROSITA currently sits at a gravitationally stable point between Earth and the sun known as Lagrange Point 2. This point, also known simply as L2, is located 932,000 miles (1.5 million kilometers) from Earth. From the vantage point of L2, the X-ray spacecraft was able to gather the data that informed this soft X-ray map by scanning the sky four times between 2019 and 2021.

“We were interested in studying the Milky Way‘s X-ray emission, particularly the circumgalactic medium, which should extend into a large sphere of plasma around our galaxy,” Gabriele Ponti, team member and an astronomer with the Brera Astronomical Observatory said in a statement translated from Italian. “Analyzing the eROSITA data, we noticed significant and unexpected variations in this diffuse radiation.

“We realized that they couldn’t come from distant galactic structures, which are constant, but must be linked to a phenomenon much closer to us: the charge exchange of the solar wind.”

Team member and Max Planck Institute researcher Konrad Denneri pointed out that the team was then able to isolate the local radiation component, adding: “In this way, we not only reconstructed an unaltered image of the emissions from deep space, but also obtained valuable information on the solar wind emitted in all directions, as well as its variations over a two-year period.”

Breaking space news, the latest updates on rocket launches, skywatching events and more!

The research suggests that solar wind emitted by the solar system follows the fluctuation of the solar cycle, weakening during periods of minimum activity and intensifying during periods of increased solar activity.

“With this work, what was previously an obstacle becomes a powerful diagnostic tool for heliophysics, allowing us to study the components of the solar wind and its interaction with the interstellar medium,” Ponti said. “Understanding how the dynamics of the heliosphere modify the appearance of the X-ray sky is fundamental to correctly interpreting the Milky Way’s warm phase.”

The team’s research was published on April 16 in the journal Science.

Robert Lea is a science journalist in the U.K. whose articles have been published in Physics World, New Scientist, Astronomy Magazine, All About Space, Newsweek and ZME Science. He also writes about science communication for Elsevier and the European Journal of Physics. Rob holds a bachelor of science degree in physics and astronomy from the U.K.’s Open University. Follow him on Twitter @sciencef1rst.

community guidelines.

” data-join-the-conversation-text=”Join the Conversation”>

You must confirm your public display name before commenting

Please logout and then login again, you will then be prompted to enter your display name.

Read More

Previous Post

These Venomous Ants Are Invading The Southeast U.S. — Here’s How To Spot Them

Next Post

Google Wallet’s Lock Screen Update Is Really Convenient For Frequent Flyers

Next Post
Google Wallet’s Lock Screen Update Is Really Convenient For Frequent Flyers

Google Wallet's Lock Screen Update Is Really Convenient For Frequent Flyers

  • About
  • Advertise
  • Privacy Policy
  • Contact

© 2026 JNews - Premium WordPress news & magazine theme by Jegtheme.

No Result
View All Result
  • Entertainment
    • Entertainment
    • Sports
  • Lifestyle
    • Fashion
    • Health
    • Travel
    • Food
  • News
    • Business
    • Politics
    • Science
  • Tech

© 2026 JNews - Premium WordPress news & magazine theme by Jegtheme.