Welcome to this weekly housing trends update, where we bring you the latest snapshot of inventory trends, listing activity, and buyer-seller dynamics across the U.S. housing market.
In addition to our monthly housing trends reports, which offer deeper insights into long-term patterns, we publish these weekly updates to provide more timely views into market changes. This effort began in response to rapid shifts in the economy and housing landscape.
You can count on a new Weekly Housing Trends update, fresh weekly data each Thursday, and a weekly video from our economists to help you stay informed.
What this week’s data shows
This week’s data shows a market navigating a complex landscape of renewed economic uncertainty and persistent affordability challenges. The housing market is facing significant recent headwinds: geopolitical tensions from the Iran war are pressuring gas prices and supply chains; mortgage rates are rising for a third consecutive week; and the Federal Reserve again signaled that future rate cuts are not imminent.
As the housing market approaches the “best time to sell” season, it sits in a precarious position, caught between long-term improvements and sudden short-term instability. On the one hand, conditions for buyers look much better than in recent years. Inventory is up, asking prices are down, and mortgage rates are at their lowest springtime levels since 2022. On the other hand, everything seems much more unsettled and uncertain than it did just a month ago.
Weekly housing trends highlights
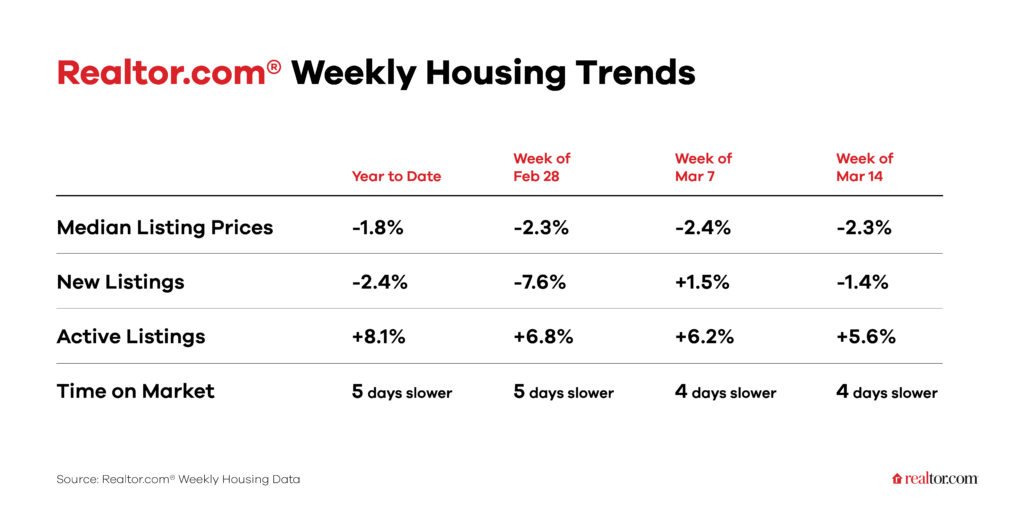
New listings, a measure of sellers putting homes up for sale, fell 1.4% year over year
The year-over-year growth of newly listed homes has flip-flopped between negative and positive throughout 2026 so far, so though February’s monthly numbers were up 2.4%, it’s not clear that will continue into March. The year-to-date total actually remains negative, signifying that there have been 2.4% fewer new listings so far this year than there were in 2025 to this point. Lower mortgage rates than at this time last year should be leading to more sellers listing, but rising rates over the past three weeks and increased economic uncertainty due to the Iran war could be holding some would-be sellers back for now. This will be the point to watch in the coming weeks and months.
Active inventory climbed 5.6% year over year
Though the number of homes for sale exceeds 2025 levels, providing homebuyers with more options, the pace of the inventory recovery has slowed. Still, inventory is up 8.1% year to date, but it’s important to remember that one reason inventory growth could be slowing is that the pace of sales may be slightly picking up compared to earlier in the year.
Homes spent 4 days longer on the market than a year ago
The median home spent 57 days on the market this week, 1 day quicker than last week, but 4 days slower than this time last year. Although homes are spending 5 days longer on the market year to date, the pace has been slightly quickening in recent weeks.
The median listing price fell 2.3% year over year
This marks the 21st consecutive week of flat or negative price growth year over year, and the eighth consecutive week in which prices are 2% or more below last year’s levels. Asking prices are falling meaningfully—welcome news to buyers. This is also evidenced by the year-over-year price-per-square-foot metric, which fell to -2.6%, the lowest on record in Realtor.com data going back to 2017. The per-square-foot figure suggests an underlying drop in home prices is taking place, not just a mix of smaller homes coming on the market.