


Welcome to this weekly housing trends update, where we bring you the latest snapshot of inventory trends, listing activity, and buyer-seller dynamics across the U.S. housing market. In addition to our monthly housing trends reports, which offer deeper insights into long-term patterns, we publish these weekly updates to provide more timely views into market changes. This effort began in response to rapid shifts in the economy and housing landscape. You can count on a new Weekly Housing Trends update, fresh weekly data each Thursday, and a weekly video from our economists to help you stay informed.
What this week’s data shows
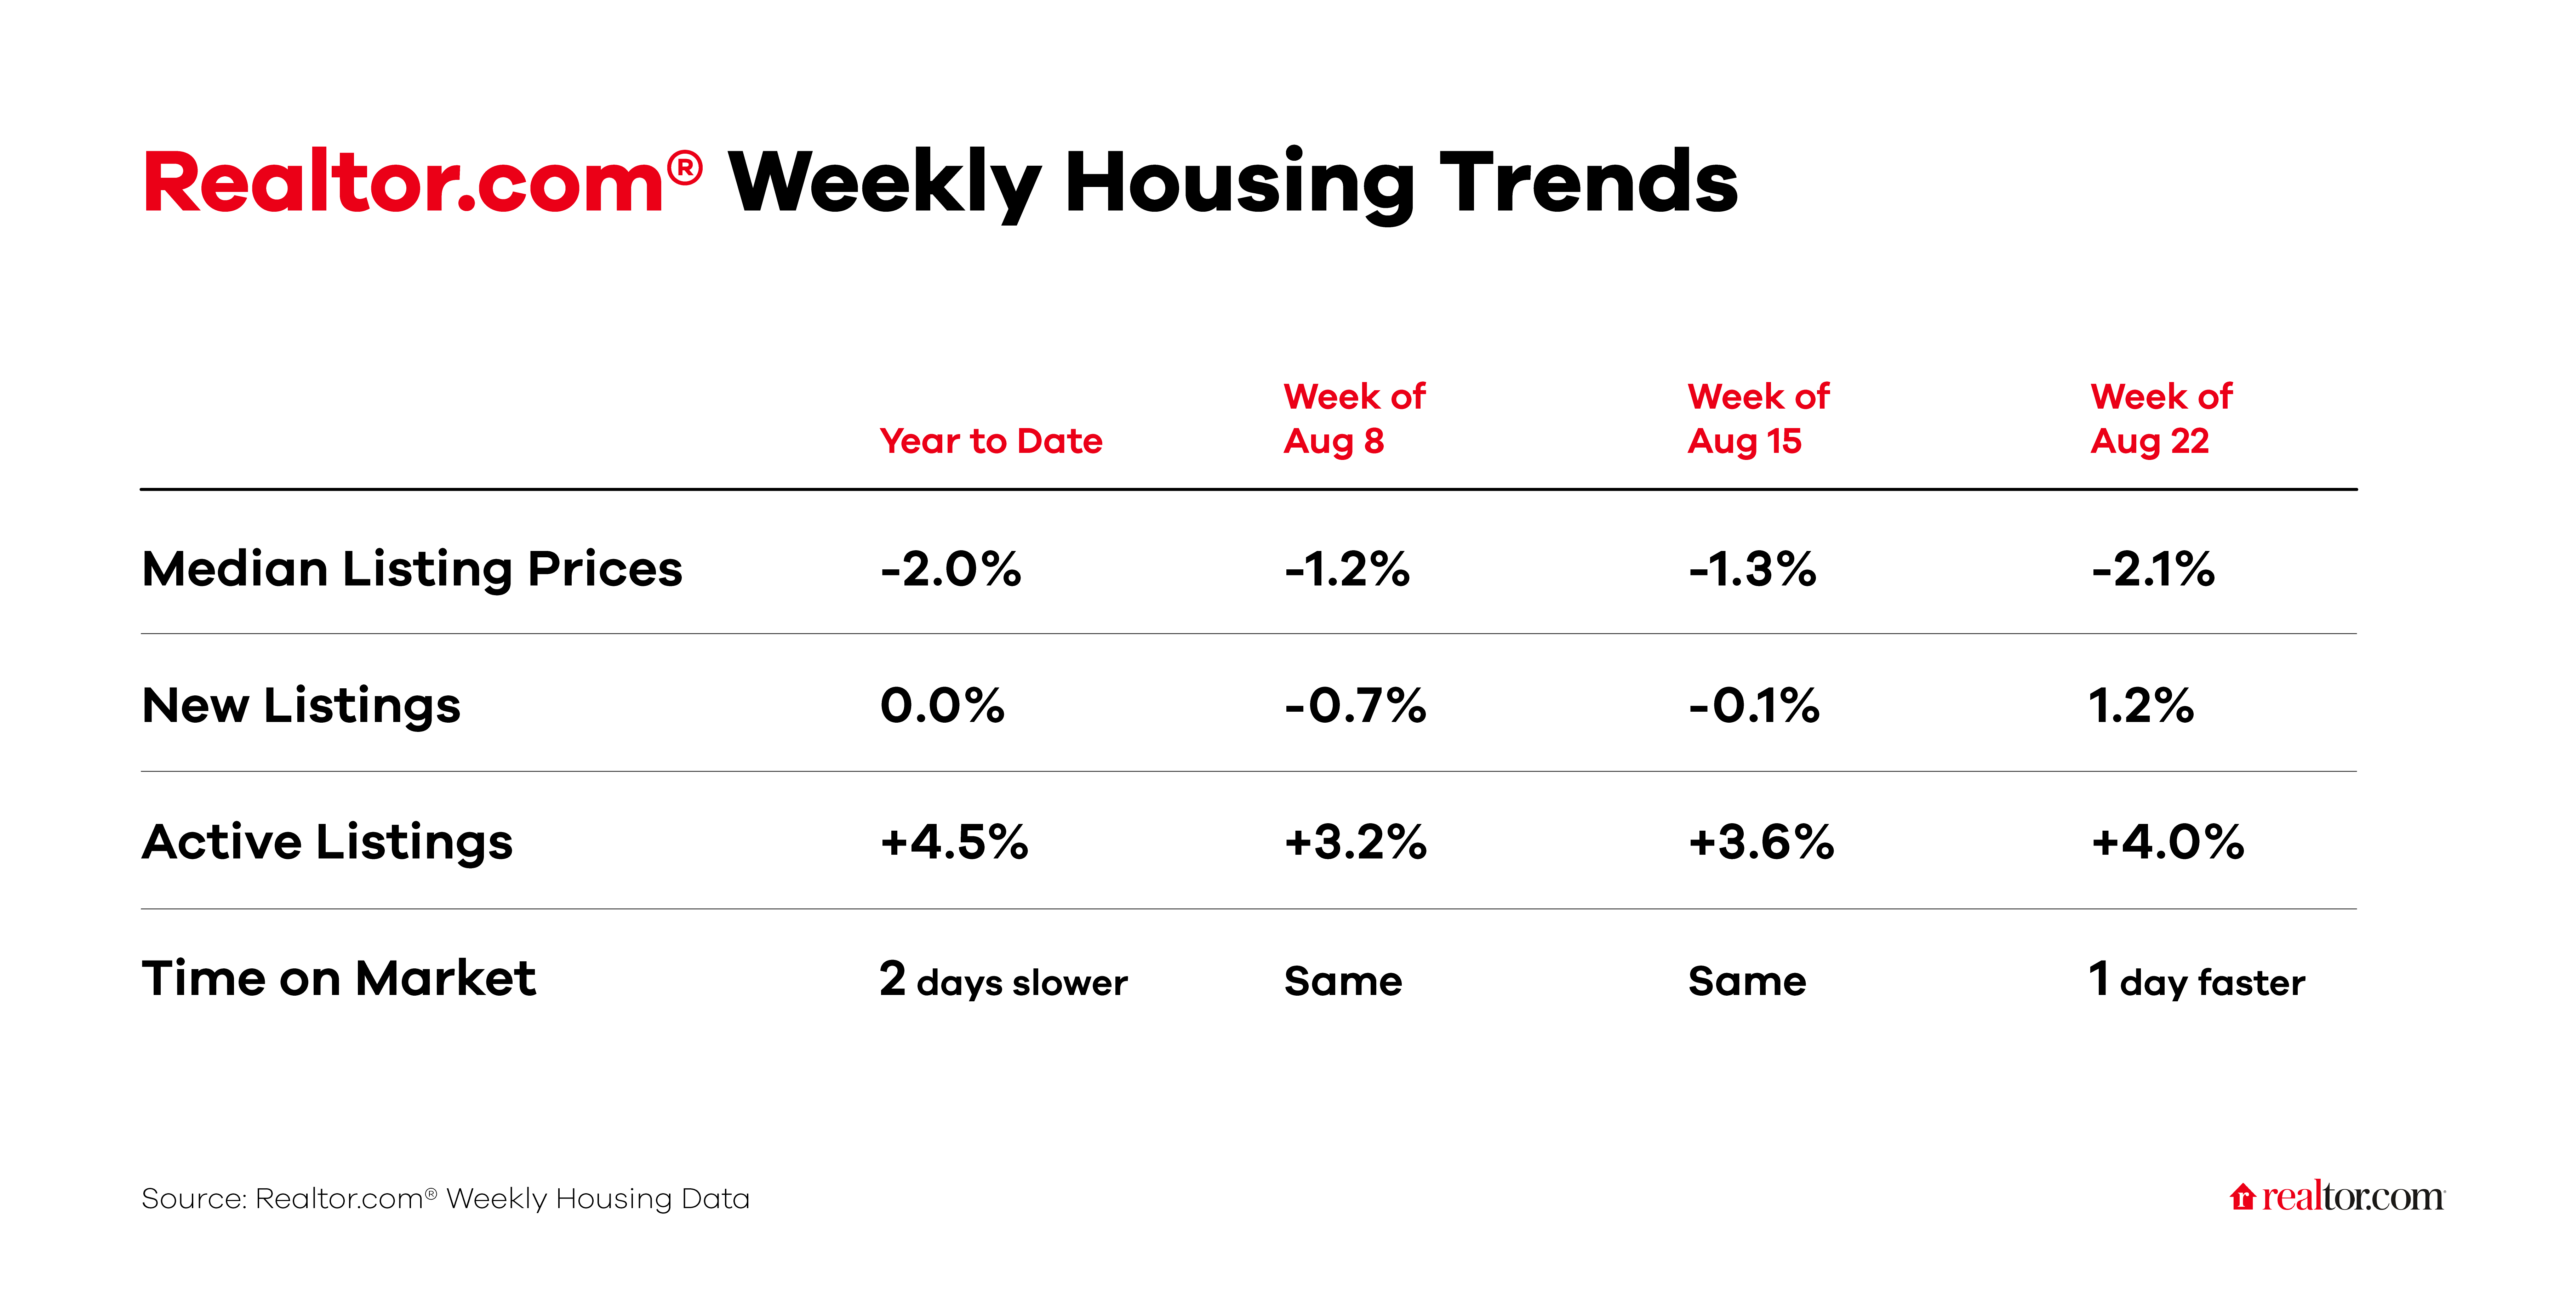
This week, prices continued to decline on a year-over-year basis, extending a stretch of asking-price weakness now in its ninth month. The bigger question all summer has been whether that reflects real demand softness or a shift in seller behavior. The evidence increasingly points to the latter, with our newly-published Summer Seller Spotlight finding that sellers pricing more realistically from the outset has helped to boost sales even in the face of housing market headwinds.
Mortgage rates have climbed above where they stood a year ago, erasing the relief that had defined the spring and most of summer. Affordability concerns and the lock-in effect remain front and center for housing, and both come through clearly in our recent cross-market demand report. Our data find a record 60.1% of home-shopping traffic across the 100 largest metros now goes to homes outside a shopper’s own metro, up from 48.2% before the pandemic. Locked-in homeowners are delaying or forgoing local moves, and those who are in the market are increasingly looking for cheaper metros.
Active inventory climbed 4.0% year over year
Homes for sale accelerated again. The number of active listings kept climbing toward 1.2 million this week, reaching 1.14 million – the highest level since December 2019. National inventory is in a very different place now than where it was during the pandemic-era shortage, but we remain well below pre-pandemic norms. Locally though, 16 of the top 50 metros now see inventories greater than pre-pandemic levels, especially those located in the South and West.
The median listing price fell 2.1% year over year
The median listing price declined to $420,000 this week, the lowest level since early April 2026 and bookending the selling season. This reflects the seasonal arc of summer list prices, which peaked this year at $430,000 in late June. Meanwhile, price per square foot fell to $223, the lowest level since spring and down 1.7% year-over-year. Listing prices have now fallen on a year-over-year basis for 32 consecutive weeks.
Homes spent less time on the market than they did a year ago
Median time on market came in at 60 days this week. This is down from 61 days this same time last year, but unchanged relative to last week. The more notable pattern: this is the 13th straight week homes have sold at the same pace or faster than a year earlier, a streak that began in late May. Before that, every week back through late 2024 showed slower-than-year-ago selling, some by over 7 days. That pattern has now reversed, but there’s still no evidence of a sales acceleration.
New listings, a measure of sellers putting homes up for sale, grew 1.2% year over year
New listings increased this week compared to a year ago. Meanwhile, mortgage rates remain elevated, which could continue to keep many homeowners feeling locked in, leaving a meaningful share of potential sellers on the sidelines. The year-to-date average is now flat relative to last year.