
Luxury Market Comparison: Raleigh-Cary, NC, vs. Washington, DC
The Policy Hub and the Research Engine
The Washington-Arlington-Alexandria metro functions as the nation’s policy hub, where legislation, federal funding, and regulatory decisions are finalized. Raleigh-Cary is the largest metro of the Research Triangle, which serves as a center for research, development, and applied science. Together, they form a pipeline where data and discovery generated in North Carolina help inform policy decisions in Washington, which in turn shape economic activity nationwide.
Headline Trends
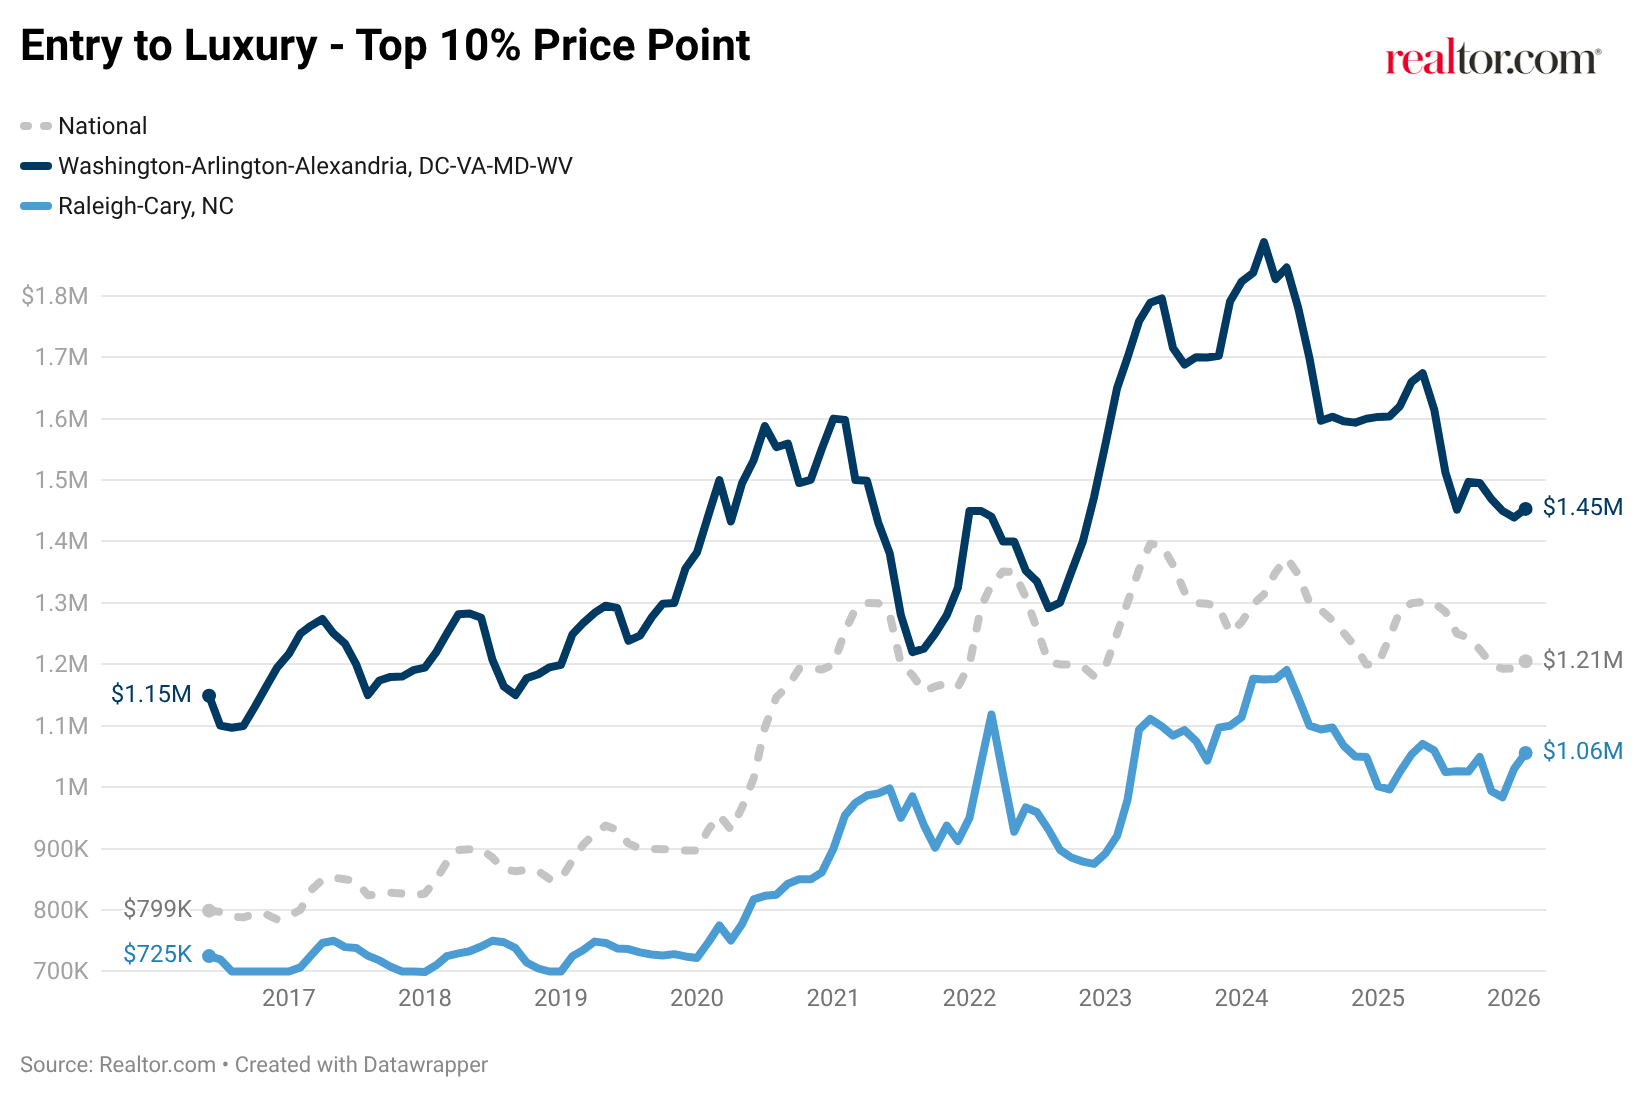
- Washington commands a mature luxury premium: The 90th percentile threshold in Washington sits at $1,453,043, roughly 21% above the national luxury benchmark of $1,205,081. Raleigh’s entry point to luxury stands at $1,055,640, about 12% below the national level.
- Different pricing trajectories: Washington’s luxury tier is recalibrating, with the 90th percentile down 9.4% year over year. In contrast, Raleigh’s 90th percentile increased 6% year over year. The divergence intensifies at the ultraluxury level: Washington’s 99th percentile has fallen 18% year over year, while Raleigh’s has climbed 13.9%.
- Washington luxury moves faster: Luxury homes in Washington spend a median of 55 days on the market, below Raleigh’s 84 and the national luxury benchmark of 83.
- Inventory depth diverges: Roughly 17.4% of Washington’s total inventory is priced at $1 million or more (1,714 listings), compared with 11% in Raleigh (477 listings).
A Connected Pipeline
The Research Triangle’s concentration of universities and research activity has long made it a destination for scientific and technical work tied to federal priorities.
The U.S. Environmental Protection Agency operates its largest campus in Research Triangle Park, a 1.2-million-square-foot complex housing roughly 15 offices, including the Office of Research and Development and the Office of Air Quality Planning and Standards. More than 2,000 professionals work at the site, producing much of the agency’s core scientific research and environmental risk analysis that informs regulatory standards ultimately finalized in Washington.
The National Institute of Environmental Health Sciences, one of 27 institutes within the National Institutes of Health, is headquartered in Research Triangle Park and is the only NIH institute with its primary campus located outside the Washington metropolitan area. Its research on how environmental exposures affect human health provides critical scientific input that informs federal public health policy and regulatory frameworks.
RTI International, the park’s founding tenant, has grown into one of the largest nongovernmental research organizations in the United States. Its work spans public health, international development, education policy, and defense, with findings that routinely inform congressional testimony and agency rulemaking in Washington.
Duke University expanded into Research Triangle Park in 2020, leasing a 273,000-square-foot facility to house its growing vaccine research operation. Meanwhile, SAS Institute, headquartered on a sprawling campus in Cary, grew from a project at North Carolina State University’s agricultural department into one of the largest privately held software companies in the world. Its analytics and AI platforms serve over 1,600 global public-sector entities, including federal agencies that rely on its tools for data-driven decision making.
Washington, DC, sits at the other end of that pipeline. As the center of federal governance and defense infrastructure, the metro translates research into policy, funding, and implementation. This dynamic has created a long-standing relationship between the two regions, in which talent, funding, and institutional priorities flow between them rather than compete.
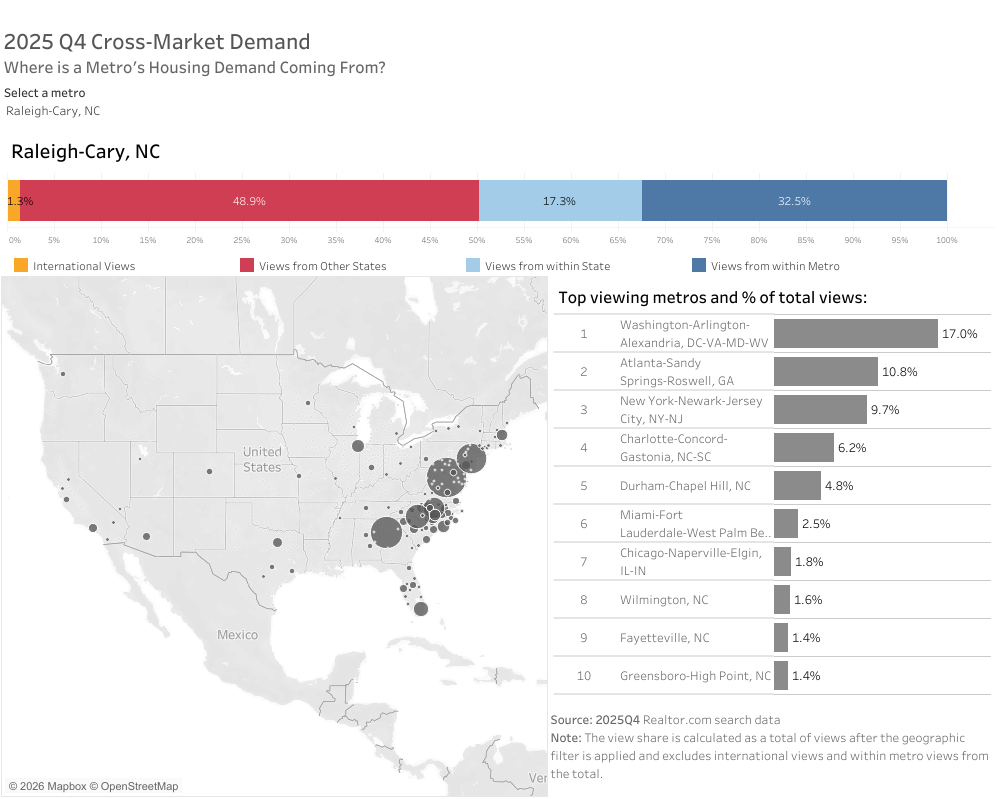
That connection is visible in migration and housing demand patterns. Cross-market data shows that 17% of out-of-market listing demand in the Raleigh-Cary metro originates from the Washington metro, making it the single largest external source of demand for Raleigh. The reverse relationship is less pronounced, with Washington’s demand more closely tied to larger global gateways such as New York. While this professional pipeline is one of several factors that establish the pathway between the two regions, buyers relocating from Washington are entering a market where the luxury baseline is nearly $400,000 lower ($1,055,640 in Raleigh compared to $1,453,043 in Washington). The combination of institutional collaboration and greater affordability supports market demand from Washington to Raleigh.
Luxury pricing: Established premium vs. emerging growth
Luxury tiers at a glance
| Area | Top 10% (Entry Luxury) | Top 5% (High-End Luxury) | Top 1% (Ultraluxury) |
| USA | $1,205,081 | $1,987,555 | $5,767,743 |
| Washington, DC | $1,453,043 | $2,318,433 | $4,949,550 |
| Raleigh | $1,055,640 | $1,602,258 | $3,495,360 |
Washington’s luxury threshold begins at $1,453,043, which sits roughly 21% above the national benchmark of $1,205,081. That premium is supported by the metro’s role as the center of federal governance, defense, and global influence, as well as a deep pool of high-income households tied to government, contracting, and those within the federal ecosystem.
Raleigh’s luxury threshold, by contrast, sits at $1,055,640, about 12% below the national level. While lower in absolute terms, this entry point represents a market that is actively expanding at the top. Raleigh’s 90th percentile has climbed 6% year over year, and its 99th percentile increased 13.9%.
Washington’s luxury market, meanwhile, is experiencing a normalization phase. The 90th percentile has declined 9.4% year over year, with deeper corrections at the top: the 95th percentile is down 10.7%, and the 99th percentile has fallen 18.0%. This pattern suggests a market adjusting after prior peaks.
These trajectories describe two markets moving in opposite directions: one consolidating from elevated levels, the other expanding into a more fully developed luxury segment.
Inventory depth and market structure
Washington’s luxury market is significantly deeper and more established. Roughly 17.4% of all listings are priced at $1 million or more, totaling 1,714 active million-dollar properties. Raleigh-Cary, while growing, remains a thinner luxury market. Approximately 11% of its listings exceed $1 million, for a total of 477 active properties. However, the growth rate is notable: Raleigh’s million-dollar listing count has increased 23.8% year over year, compared with 7.1% growth in Washington, suggesting that the inventory gap is narrowing as the Research Triangle’s luxury market continues to scale.
Luxury tempo
Buyer behavior further differentiates the two metros. In Washington, homes in the top 10% are moving more quickly, spending a median of 55 days on the market, 28 days faster than the national luxury benchmark of 83. This pace reflects a deeper pool of high-income buyers.
In Raleigh-Cary, luxury homes take longer to sell, with a median of 84 days on the market. That longer timeline reflects a smaller, more selective luxury-buyer pool, a market still establishing pricing benchmarks, and a broader local buyer base that skews toward lower price tiers.
Two eras of luxury housing stock
Perhaps the starkest contrast between these two luxury markets is not price or pace, but the age of the homes themselves. Washington’s luxury inventory draws from a deep well of housing history, while Raleigh’s is defined more by new construction.
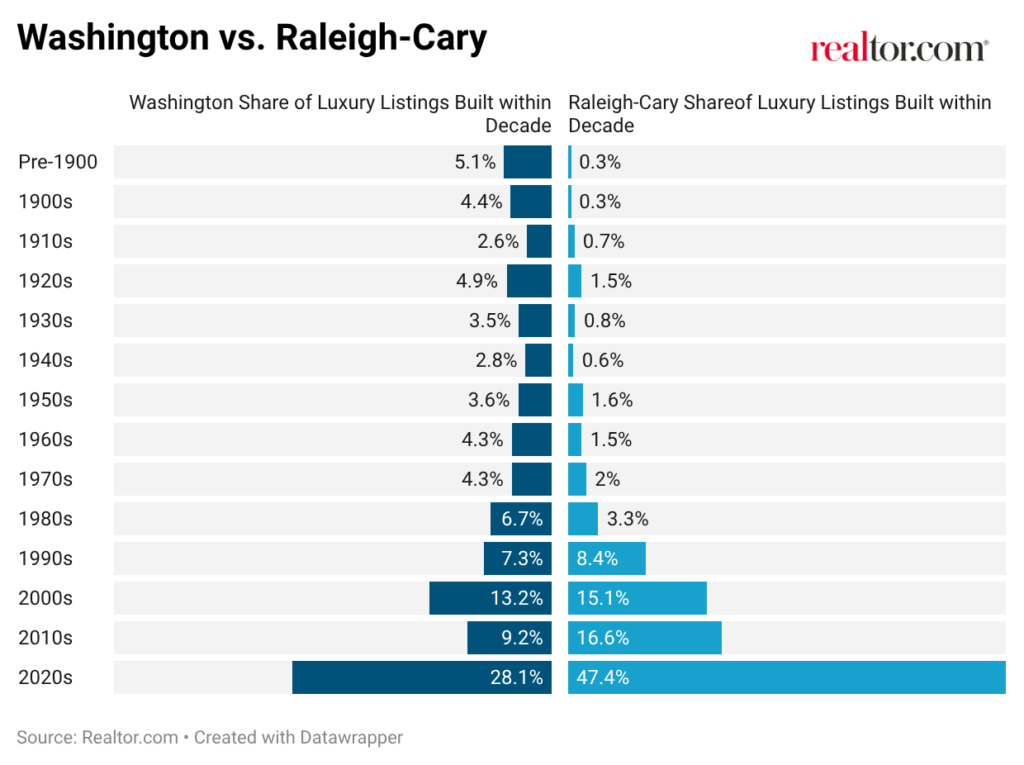
In Raleigh-Cary, nearly half of all luxury listings (47.4%) were built in the 2020s and 16.6% date to the 2010s. Combined, roughly two-thirds of Raleigh’s luxury inventory has been built within the past 15 years. Homes built before 1990 account for roughly 13% of the luxury supply, representing a market with newly developed communities.
Washington’s luxury stock is far more distributed across eras. While the 2020s still represent the largest single decade at 28.1%, the concentration is significantly lower than Raleigh’s. Homes built before 1950 account for nearly a quarter (23.4%) of Washington’s luxury supply, a segment that barely registers in Raleigh (2.7%). The 1980s through 2000s collectively represent 27.2%, reflecting a market where luxury has accumulated over generations rather than arriving in a single building cycle.
This divergence shapes the buyer experience in each market. In Washington, luxury buyers can choose between a restored 1920s Colonial in Bethesda, a midcentury estate in McLean, or a newly built contemporary in Vienna. In Raleigh, the luxury market is defined largely by new-build homes: modern construction on spacious lots, often in master-planned communities or recently developed enclaves. Both models appeal to different buyer profiles.
Space and lifestyle
| $1 Million – $2 Million Homes | ||
| Area | Median Square Feet | Price Per Square Foot |
| USA | 2,913 | $481 |
| Washington, DC | 3,389 | $409 |
| Raleigh | 3,853 | $358 |
Raleigh offers larger, newer homes. In the $1 million to $2 million tier, Raleigh homes have a median size of 3,853 square feet, substantially more than the national median of 2,913. Washington homes in the same band offer a median of 3,389. While still above the national level, it has a smaller footprint than the Raleigh metro.
Where the top of the market is concentrated
Washington’s Most Expensive ZIP Codes
| Rank | ZIP Code | Area | Median Listing Price | Median Square Feet | Median Year Built |
| 1 | 22101 | McLean | $3,270,000 | 7,109 | 1982 |
| 2 | 22066 | Great Falls | $2,555,750 | 6,690 | 1985 |
| 3 | 22180 | Vienna | $2,297,000 | 5,815 | 1997 |
| 4 | 20817 | Bethesda | $1,972,450 | 4,704 | 1970 |
| 5 | 22043 | Falls Church | $1,839,050 | 4,616 | 1983 |
Washington’s most expensive ZIP codes are clustered in the Northern Virginia suburbs and Montgomery County, MD, areas defined by generational wealth, proximity to federal power centers, and deeply established residential enclaves.
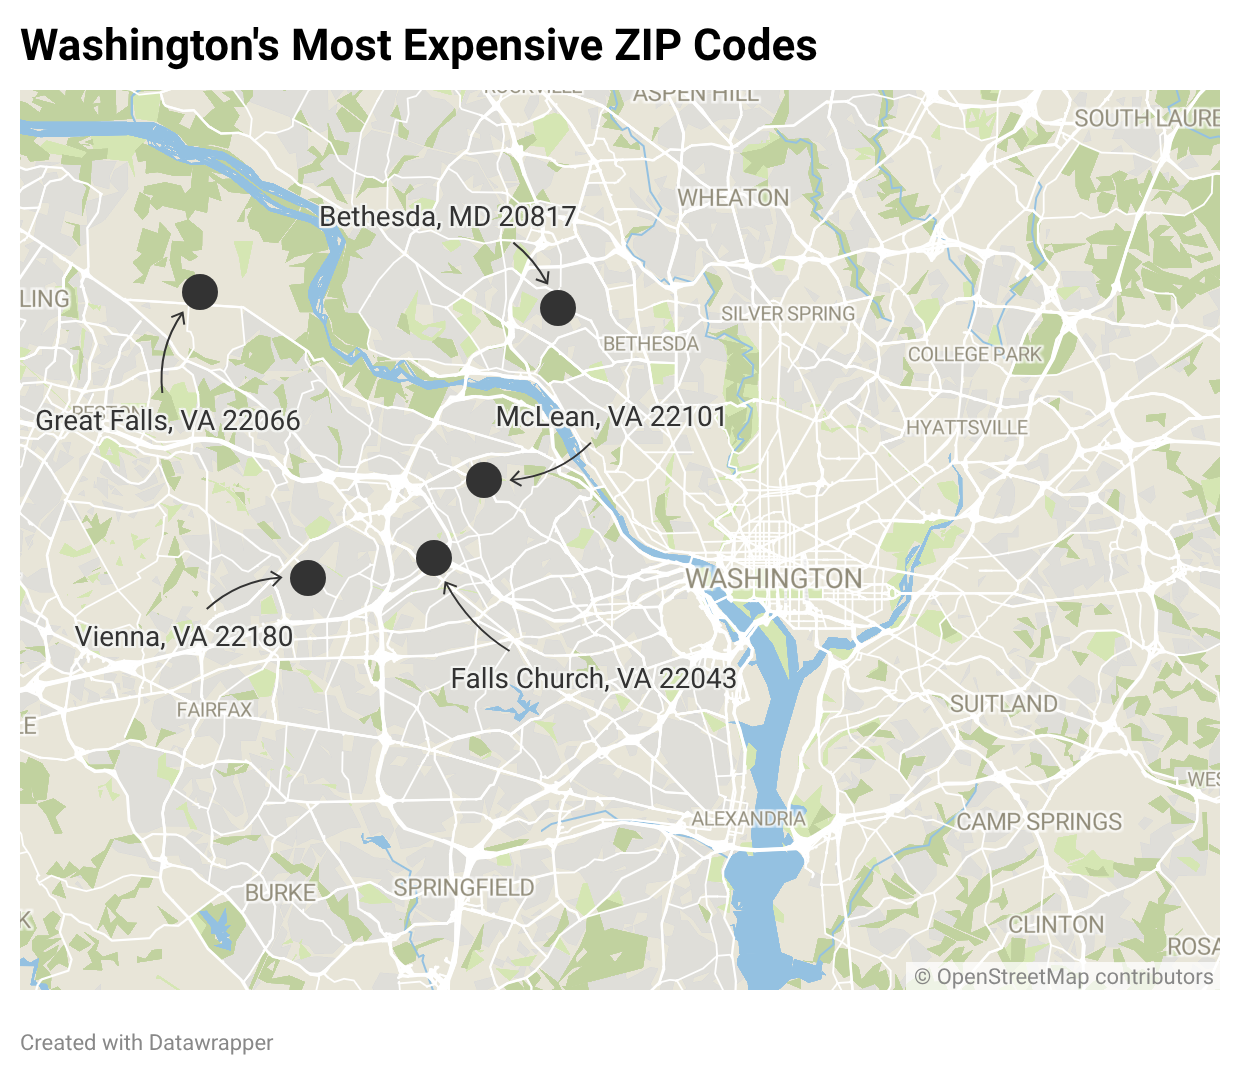
McLean (22101) leads the metro with median listing prices of $3.27 million and a median home size exceeding 7,100 square feet. Known for its diplomatic estates, gated communities, and proximity to CIA headquarters and Tysons Corner, McLean represents the intersection of government influence and private-sector wealth that characterizes Washington’s luxury landscape. Great Falls (22066) follows closely at $2.56 million, offering even more rural estate-style living on larger lots, with equestrian properties and heavily wooded acreage that set it apart from more suburban luxury enclaves.
Vienna (22180), Bethesda (20817), and Falls Church (22043) round out the top five, each posting median listing prices between $1.84 million and $2.30 million. These ZIP codes illustrate how Washington’s luxury market fans out across multiple corridors, with each community offering a distinct profile: Vienna skews newer (median year built of 1997), while Bethesda (1970) reflects an older, more established housing stock where premium values are driven by location within the Beltway and access to top-rated schools.
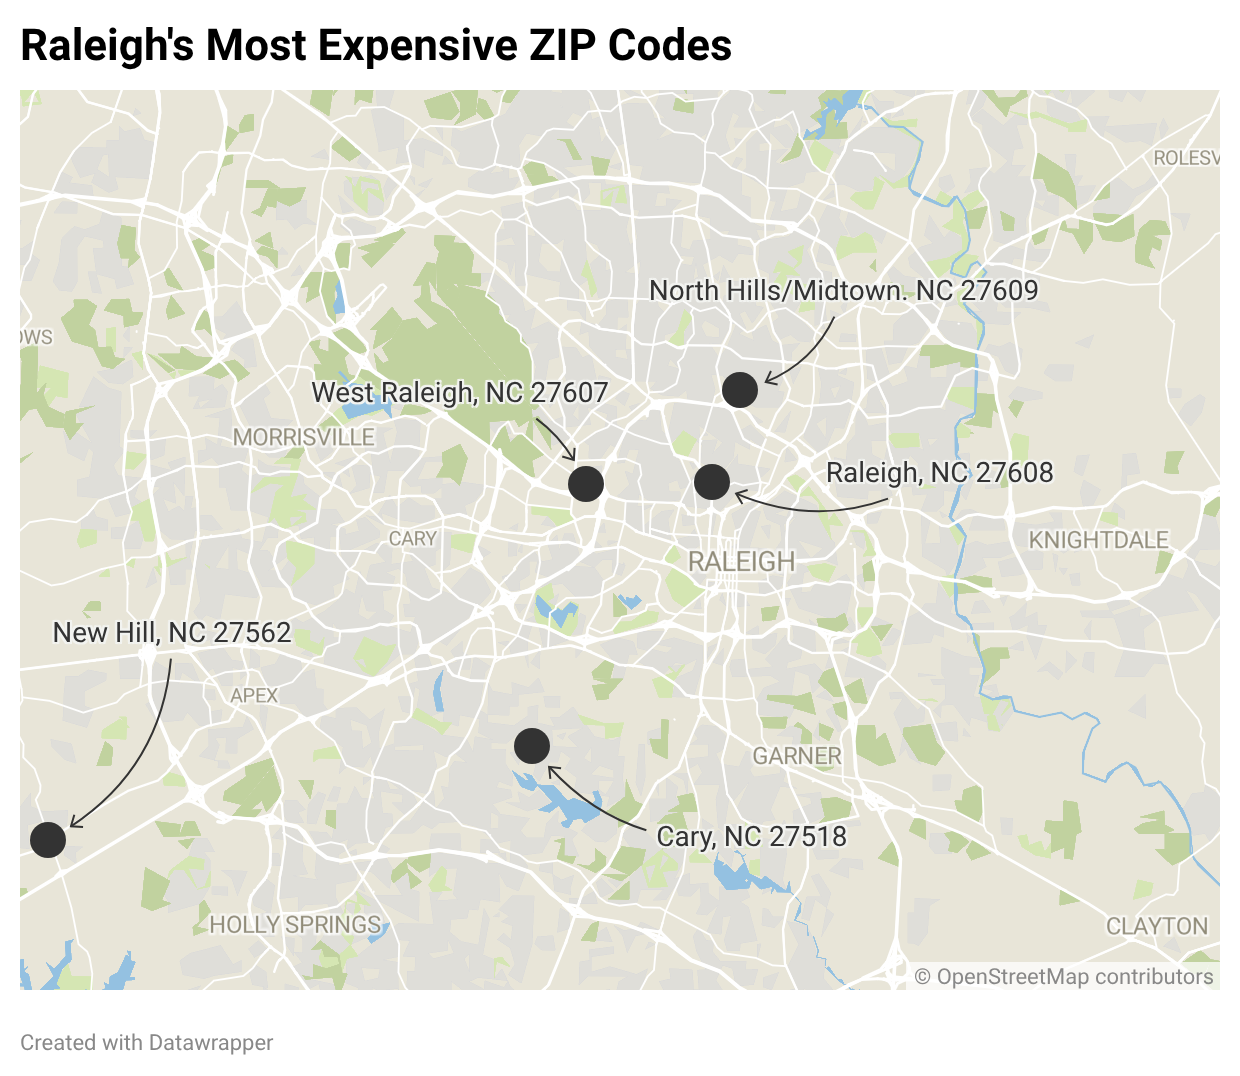
Raleigh’s Most Expensive ZIP Codes
| Rank | ZIP Code | Area | Median Listing Price | Median Square Feet | Median Year Built |
| 1 | 27608 | Raleigh | $1,198,750 | 2,731 | 1992 |
| 2 | 27607 | West Raleigh | $1,063,750 | 3,070 | 1987 |
| 3 | 27609 | North Hills/Midtown | $795,000 | 2,649 | 1978 |
| 4 | 27562 | New Hill | $742,500 | 3,284 | 2023 |
| 5 | 27518 | Cary | $728,500 | 2,942 | 1997 |
Raleigh’s two most expensive ZIP codes are concentrated within the city itself, reflecting a luxury market that is still forming around a relatively compact geographic footprint rather than fanning out across multiple established suburban corridors.
The 27608 ZIP code leads Raleigh’s pricing hierarchy at $1,198,750. This area encompasses some of Raleigh’s most desirable in-town neighborhoods, where proximity to downtown, mature tree canopy, and established lot sizes command a premium. At a median year built of 1992, the housing stock here is older by Raleigh standards, reflecting a neighborhood where value is driven by location rather than new construction.
The 27607 ZIP code follows closely at $1,063,750, offering slightly larger homes (3,070 square feet) with a median build year of 1987. While these intown footprints are notably smaller than the 3,853-square-foot median found across Raleigh’s broader $1 million to $2 million tier, they command top-of-market pricing due to location prestige, mature lots, and proximity to downtown rather than sheer size.
The North Hills/Midtown area in 27609, New Hill (27562), and Cary (27518) round out the top five, each posting median prices between $728,500 and $795,000. Notably, New Hill stands out with a median year built of 2023, reflecting the type of newly developed, master-planned luxury that increasingly defines Raleigh’s high-end market.
Three of Raleigh’s five most expensive ZIP codes post median listing prices below the metro’s own luxury entry point of $1,055,640, a sign that even the most expensive pockets of the market are still closely tethered to the broader pricing structure rather than operating in a distinct tier.
The median year built across these top ZIPs ranges from 1978 to 1997 (excluding New Hill), generally much older than the metro’s overall median build year of 2019. Raleigh’s most expensive neighborhoods are defined by established, in-town locations where value is driven by proximity and neighborhood prestige. At the same time, the broader luxury market is shaped by newer construction on the metro’s expanding edges. Both patterns coexist, giving Raleigh a luxury landscape that spans legacy enclaves and modern planned communities alike.
Compared with Washington’s top ZIP codes, Raleigh’s most expensive areas operate at a materially lower price band. The median listing price in McLean ($3.27 million) is nearly three times that of Raleigh’s top ZIP code, underscoring the structural depth gap between the two metros at the very top of the market.
The takeaway
Raleigh-Cary, NC, and Washington, DC, represent two interconnected but distinct luxury housing markets.
Washington commands a premium, supported by its role as the center of federal governance, defense, and global influence. It offers depth and a well-established luxury tier, with a quicker turnover than the Raleigh metro. Its housing stock spans more than a century, giving buyers access to everything from pre-war Colonials to newly built contemporary estates. However, Washington is currently experiencing meaningful price normalization at the luxury tiers.
Raleigh-Cary reflects a growth-oriented luxury market, where rising demand, expanding research-driven industries, and inbound migration from Washington are pushing prices higher even as the market remains more accessible. Its luxury tier is still scaling, with growing million-dollar inventory and strong year-over-year appreciation across all price percentiles. Nearly half of its luxury supply has been built since 2020, reflecting a market defined by new construction, modern amenities, and expanding suburban development.
Rather than strictly competing, these metros have a complementary relationship. One generates the research and talent pipelines; the other converts those inputs into policy and economic power. In housing terms, that dynamic creates a clear divide: an established, deep luxury market in Washington and an emerging luxury market in Raleigh.
Methodology
All data in this report is sourced from Realtor.com® listing trends as of February 2026, reflecting active inventory of existing homes, including single-family residences, condos, townhomes, row homes, and co-ops. Listings reflect only those posted on MLS platforms that provide listing feeds to Realtor.com. New-construction listings are excluded unless actively listed on participating MLSs.
Metropolitan and micropolitan areas are defined using the Office of Management and Budget’s OMB-2023 delineations, with Claritas 2025 household estimates used for relative comparisons. Where appropriate, we limited the analysis to metros or micros with a minimum average number of active million-dollar listings over the past year to ensure meaningful comparisons.
Historical listing trend data extends to July 2016, but year-over-year comparisons in this report use February 2025 as the baseline.
Luxury by the Numbers
90th percentile = Entry-level luxury (top 10% of prices)
95th percentile = High-end luxury
99th percentile = Ultraluxury (often rare or custom properties)
