


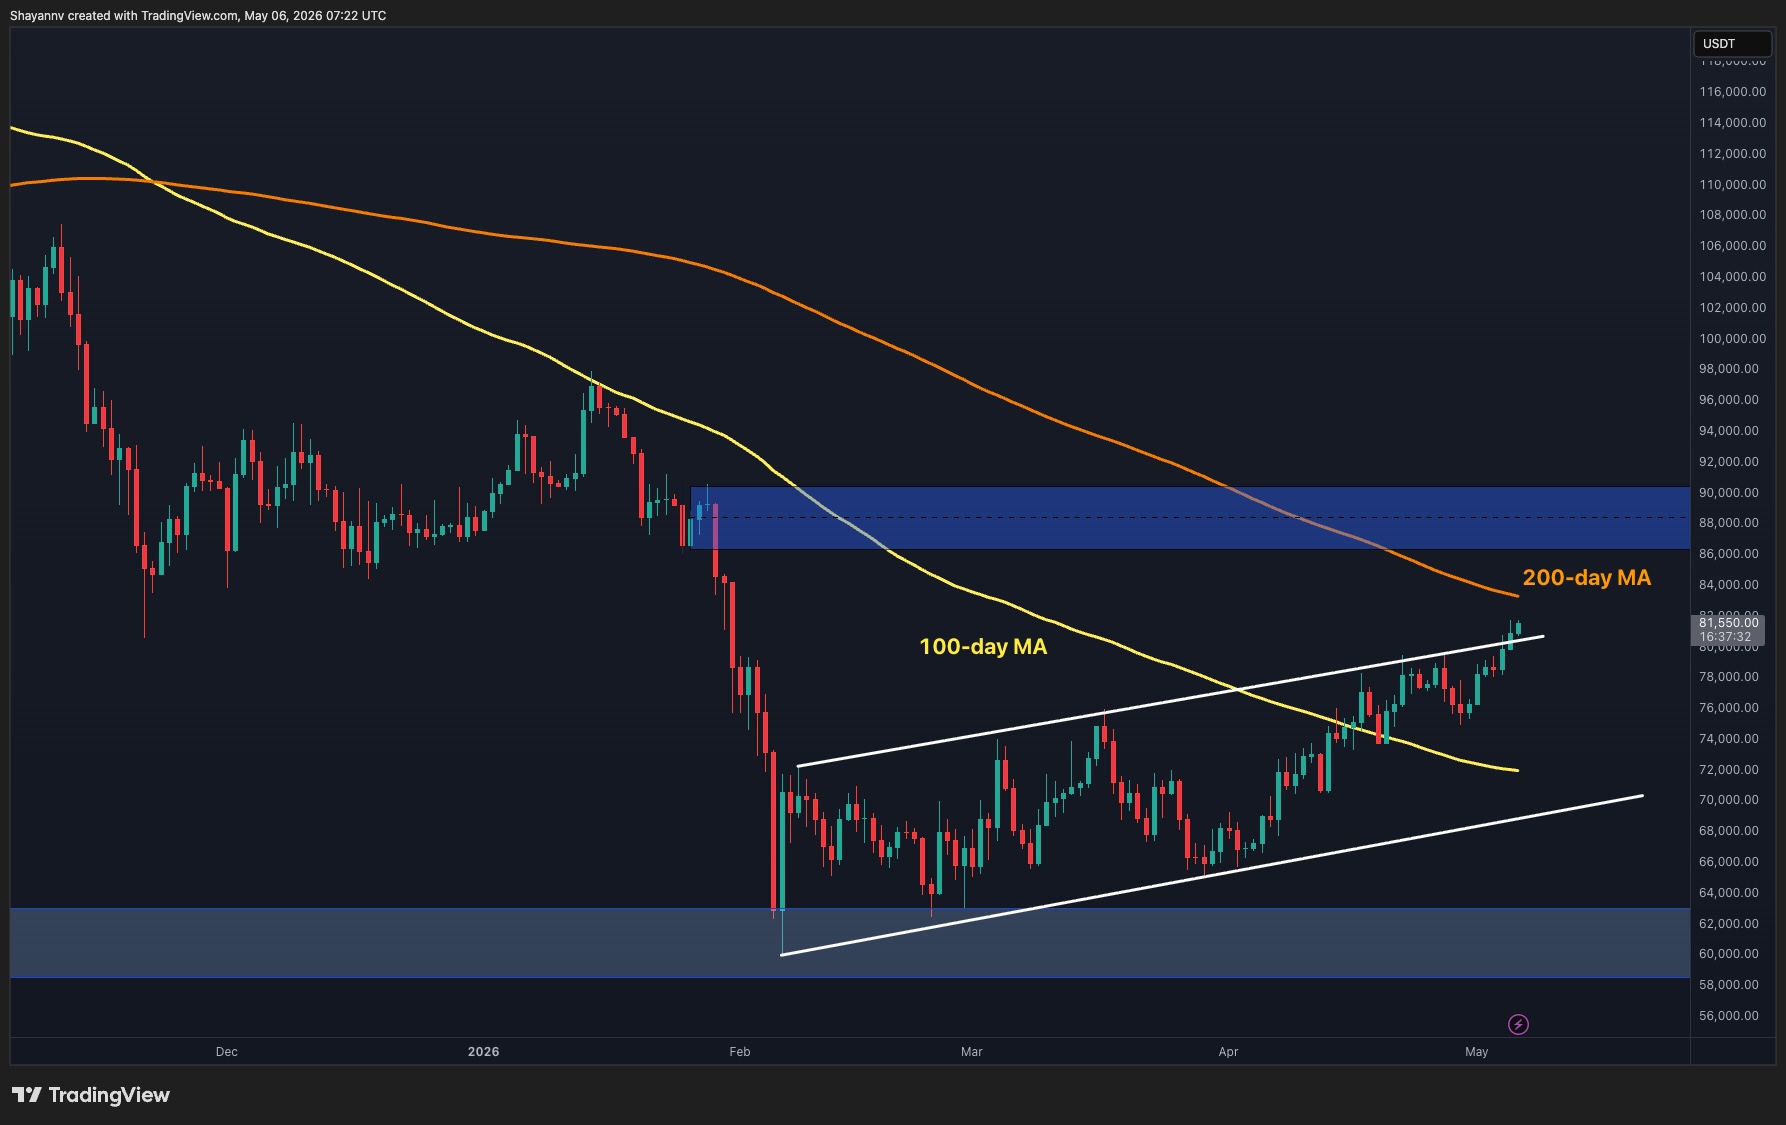
Bitcoin has continued its recovery structure with buyers gradually regaining control. The recent upward expansion has pushed the market back toward key resistance levels, while momentum indicators and market structure suggest that BTC is attempting to transition from a corrective phase into a broader bullish continuation. However, the market is now approaching a decisive area where confirmation is required before a sustained rally can unfold.
Bitcoin Price Analysis: The Daily Chart
On the daily timeframe, BTC has recently displayed notable bullish momentum and managed to slightly break above the upper boundary of the ascending channel that has contained the price action for the past several months. This breakout is an important technical development, as it signals strengthening buyer dominance after weeks of gradual accumulation. Nevertheless, the breakout still requires confirmation.
If the price stabilizes above the channel’s upper boundary at $80K and forms a successful pullback toward it, the breakout would likely be validated, opening the door for another bullish leg toward higher resistance zones. At the same time, Bitcoin is approaching a major resistance confluence around the $83K range, where the 200-day moving average is currently located.
This area could temporarily slow the bullish momentum. In this structure, the broken price channel now acts as dynamic support, while the $83K-$85K region remains the next major hurdle for buyers.

BTC/USDT 4-Hour Chart
On the 4-hour chart, a new ascending price channel has emerged, highlighted by the yellow structure. The market has been respecting both the upper and lower boundaries of this formation, indicating an orderly bullish trend in the short term. Bitcoin is currently trading near a significant resistance zone around the $81K-$84K range, represented by the green supply region.
Meanwhile, the $75K-$78K region, highlighted by the brown box, is acting as the main short-term support. Given the proximity to resistance and the recent sharp rally, the market is likely to experience consolidation and fluctuating price action within this channel over the coming days. A breakout above the $81K-$84K resistance could trigger continuation toward higher levels, while a rejection and breakdown below the $75K-$78K support may lead to a deeper correction within the broader structure.

Sentiment Analysis
From a liquidation perspective, the heatmap indicates that Bitcoin has recently swept through a large portion of the liquidity concentrated around the $80K region. This suggests that a significant number of short positions have already been liquidated during the recent rally.
However, notable liquidity clusters still remain above the current market price, particularly around the $85K-$95K region, making these levels attractive targets for further upside expansion and potential short squeezes. On the other hand, substantial liquidity pools continue to exist at lower price levels, especially below the $60K-$70K range. These deeper liquidity zones could still attract price in the coming months if broader market conditions weaken or if the current breakout fails to sustain itself.
Overall, Bitcoin is showing improving bullish momentum after reclaiming key technical levels, but the market is now entering a critical resistance zone. The interaction between the broken ascending channel, the 200-day moving average around $88K-$90K, and the surrounding liquidity clusters will likely determine whether BTC can sustain a broader uptrend or enter another consolidation phase before the next major move.

LIMITED OFFER for CryptoPotato readers at Bybit: Use this link to register and open a $500 FREE position on any coin!
Disclaimer: Information found on CryptoPotato is those of writers quoted. It does not represent the opinions of CryptoPotato on whether to buy, sell, or hold any investments. You are advised to conduct your own research before making any investment decisions. Use provided information at your own risk. See Disclaimer for more information.
